How to use the FV function

What is the FV function?
The FV function returns the future value of an investment based on a constant interest rate.
You can use the FV function with either periodic constant payments, or a single lump sum payment.
1. Introduction
What are periodic constant payments?
Periodic constant payments are payments that are made at regular intervals such as monthly, quarterly, or yearly and have the same amount each time.
What is a constant interest rate?
A fixed interest rate is an interest rate that remains the same throughout the term of a loan or an investment.
What is a single lump sum payment?
A single lump sum payment refers to making a financial payment in full all at once, instead of in multiple payments over time.
What is the present value?
The present value is the initial amount that also will earn interest.
Related functions
| Function | Description |
|---|---|
| RATE(nper, pmt, pv, [fv], [type]) | Returns the interest rate per period of an annuity |
| PV(rate, nper, pmt, [fv], [type]) | Returns the present value of an investment. |
| FV(rate, nper, pmt, [pv], [type]) | Returns the future value of an investment. |
| PDURATION(rate, pv, fv) | Returns the periods needed for an investment to reach a future value. |
2. FV function Syntax
FV(rate, nper, pmt, [pv], [type])
| rate | Required. The interest rate you want to use. |
| nper | Required. The total number of payments. |
| pmt | Required. The payment made each period. |
| [pv] | Optional. The present value. |
| [type] | Optional. When payments are due. 0 (zero) is the default value. 0 - At the end of the period. 1 - At the beginning of the period. |
- If pmt is omitted the pv argument must be included.
- You must include the pmt argument if the pv argument is omitted. It is then assumed to be 0 (zero).
- It is possible to use both the pv and pmt arguments at the same time.
Why is pv and pmt arguments entered as negative values in the FV function?
In the FV (Future Value) function, the pv and pmt arguments are typically entered as negative values for a specific reason. Cash inflows are represented as positive values, and cash outflows are negative values.
3. FV function Example 1

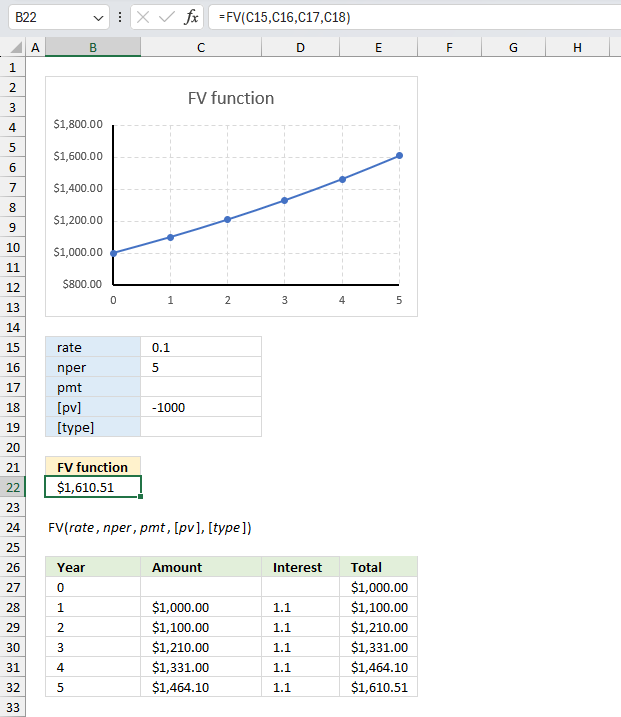
If you invest $1,000 today in an account that pays 10% annual interest compounded annually, what will be the future value of your investment after 5 years?
The image illustrates the use of the FV (Future Value) function in Excel to calculate the future value of an investment based on specified parameters. The chart titled "FV function" shows a line graph depicting the growth of the future value over 5 periods (0 to 5 on the x-axis). The y-axis represents the future value amount.
The input arguments for the FV function are provided:
rate: 0.1 (10% interest rate)
nper: 5 (number of periods)
pmt: (no value given, indicating no periodic payment)
[type]: (no value given, assuming the default end-of-period payment)
Formula in cell B3:
The output of the FV function, based on the given arguments, is $1,610.51 which represents the future value of the investment after 5 periods with a 10% interest rate and an initial investment of $1000.
Below the chart and input arguments a table shows the calculation details for each period including the Year, Amount (initial investment and accumulated future value), Interest earned, and Total (future value).
4. FV function Example 2

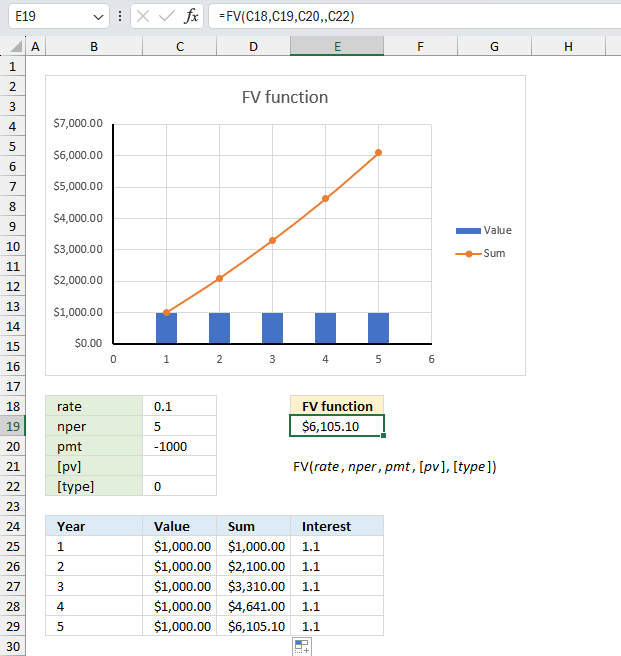
If you invest $1,000 every year in an account that pays 10% annual interest also compounded annually, what will be the future value of your investment after 5 years?
The input arguments for the FV function are :
rate: 0.1 (10% interest rate)
nper: 5 (number of periods)
pmt: -1000
[pv]: (no value given indicating no initial value)
[type]: 0 (payment is timed at the end of the period)
Formula in cell E19:
The output of the FV function based on the given arguments is $6,105.10 which represents the future value of the investment after 5 periods with a 10% interest rate and an investment of $1000 in each period.
The chart titled "FV function" shows a line graph depicting the growth of the future value over 5 periods (1 to 5 on the x-axis). The y-axis represents the future value amount.
Below the chart and input arguments, a table shows the calculation details for each period, including the Year, Value (accumulated future value).
5. FV function Example 3

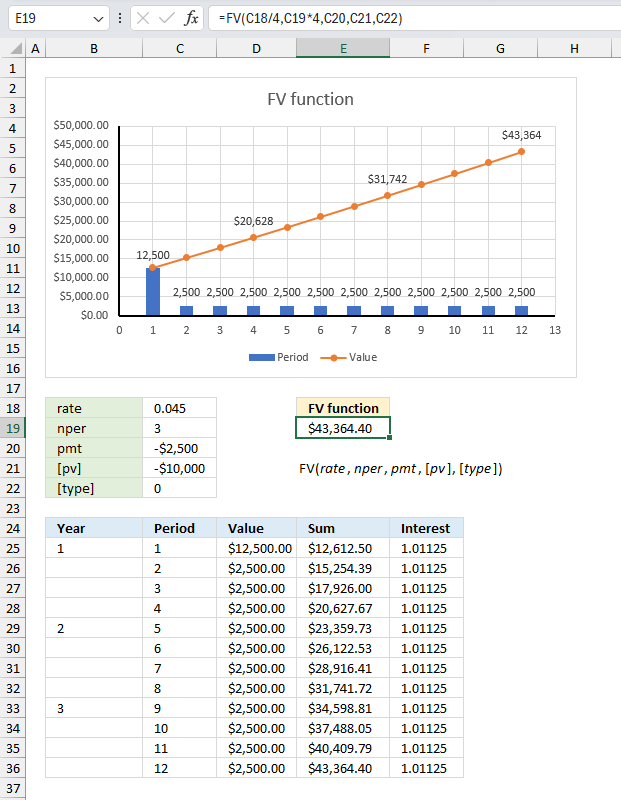
A company plans to set aside $2,500 at the end of each quarter for the next 3 years to fund a future project. The company sets aside an initial $10,000 as a start. If the investment earns 4.5% annual interest compounded quarterly, what will be the future value of the investment at the end of 3 years?
The input arguments for the FV function are :
rate: 0.045 (annual 4.5% interest rate, divide this by 4 to get the quarterly interest rate)
nper: 3 (number of periods, we multiply by 4 in the formula to get the correct number of quarters)
pmt: -2,500
[pv]: -10,000
[type]: 0 (payment is timed at the end of the period)
Formula in cell E19:
The output of the FV function based on the given arguments is $43,364.40 which represents the future value of the investment after 3 periods with a 4.5% interest rate and an investment of $2,500 in each period, and a $10,000 start value.
The chart titled "FV function" shows a line graph depicting the growth of the future value over 12 periods or quarters (1 to 12 on the x-axis). The y-axis represents the future value amount.
Below the chart and input arguments, a table shows the calculation details for each quarter, including the period, value, and sum (accumulated future value).
6. FV function Example 4

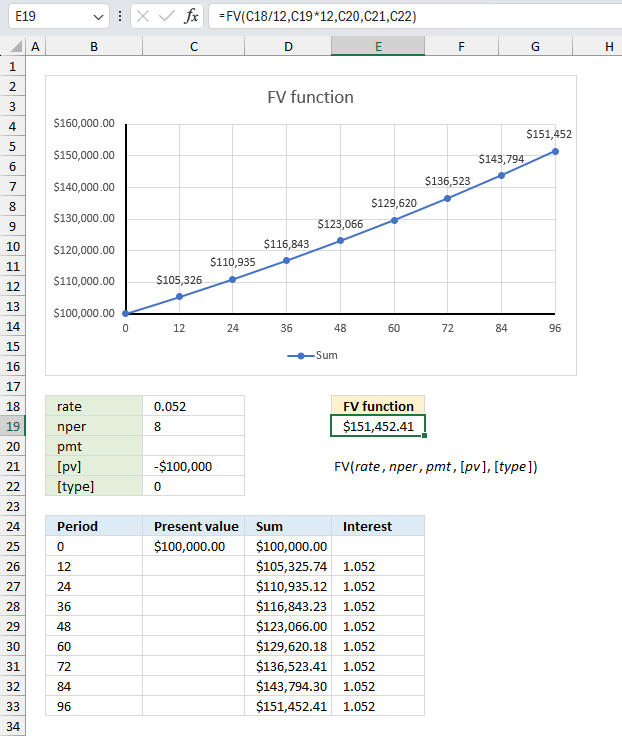
A business invests $100,000 today in a fixed-income security that pays 5.2% annual interest compounded monthly. What will be the future value of the investment after 8 years?
The arguments for the FV function are :
rate: 0.052 (annual 5.2% interest rate, divide this by 12 to get the monthly interest rate)
nper: 8 (number of periods, we multiply by 12 in the formula to get the correct number of periods or months)
pmt: 0 (no payments)
[pv]: -100,000 (start value or present value)
[type]: 0 (payment is timed at the end of the period)
Formula in cell E19:
The output of the FV function based on the given arguments is $151,452.41 which represents the future value of the investment after 96 periods (or 8 years, 8*12 = 96) with a 5.2% interest rate and an investment of $100,000.
The chart titled "FV function" shows a line graph depicting the growth of the future value over 96 periods or months (1 to 96 on the x-axis). The y-axis represents the future compounded amount.
Below the chart and input arguments, a table shows the calculation details for each year, including the period, value, and sum (accumulated future value).
Functions in 'Financial' category
The FV function function is one of 27 functions in the 'Financial' category.
How to comment
How to add a formula to your comment
<code>Insert your formula here.</code>
Convert less than and larger than signs
Use html character entities instead of less than and larger than signs.
< becomes < and > becomes >
How to add VBA code to your comment
[vb 1="vbnet" language=","]
Put your VBA code here.
[/vb]
How to add a picture to your comment:
Upload picture to postimage.org or imgur
Paste image link to your comment.
Contact Oscar
You can contact me through this contact form