How to use the F.TEST function
What is the F.TEST function?
The F.TEST function calculates the two-tailed probability from an F-test, the value shows if the variances from two data sets are not significantly different.
This function was introduced in Excel 2010 has replaced the FTEST function which is now outdated.
Table of Contents
1. Introduction
What is the two-tailed probability from an F-test?
The two-tailed probability from an F-test refers to testing against the alternative hypothesis that the two population variances are not equal without specifying direction.
The F-test compares two sample variances by forming a ratio that follows an F-distribution. It tests the null hypothesis that the population variances are equal.
If the variances are not equal which can occur in either direction meaning one could be larger or smaller. A two-tailed test checks both flanks of the F distribution for the probability that the ratio is quite large or quite small. The two-tailed p-value is the total area in both tails combined.
What is a hypothesis in statistics?
In statistics, a hypothesis is an assumption about some aspect of a population or underlying probability model. Hypotheses are of two main types:
- Null hypothesis (H0) - Represents the status quo. Asserts there is no meaningful effect, relationship, or difference in the parameter of interest between groups.
- Alternative hypothesis (H1) - Asserts there is a statistically significant effect in the parameter. Reflects a potential research finding or relationship.
A statistical hypotheses state an assumption that can be tested to reach conclusions from experimental data using methods like t-tests, ANOVA, or chi-square tests.
What is the F probability?
The F-distribution or F-ratio is a continuous probability distribution that compare the variances of two populations.
What is variance?
The variance shows how much a set of numbers are spread out from their average value.
Σ(x- x̄)2/(n-1)
x̄ is the sample mean
n is the sample size.
What is a null distribution?
The null hypothesis in the F-distribution is that two independent normal variances are equal. If the observed ratio is too large or too small, then the null hypothesis is rejected, and we conclude that the variances are not equal.
When is a f-distribution used?
The F-distribution is used in the F-test in analysis of variance comparing two variances, as the distribution of the ratio of sample variances when the null is true of no difference between population variances.
What is a continuous probability distribution?
A continuous probability distribution is defined over an interval and range of continuous values, giving the probability an outcome is exactly equal to any value, and having an area under its probability density curve equal to 1.
2. Syntax
F.TEST(array1, array2)
3. Arguments
| array1 | Required. The first data set. |
| array2 | Required. The second data set. |
4. Example 1

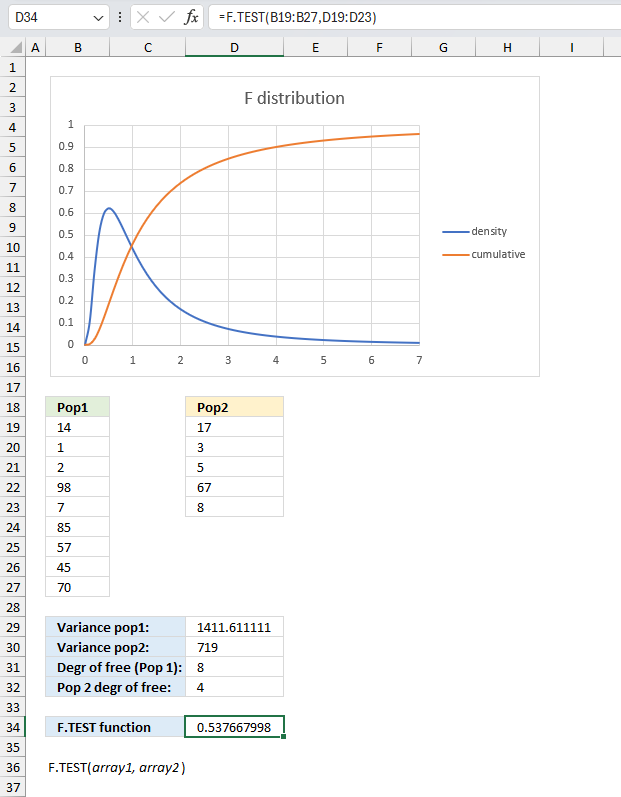
Two samples have variances of 1411 and 719, with 8 and 4 degrees of freedom, respectively. Use the F.TEST function to determine if the variances of the two populations are significantly different at a 5% significance level?
The values for population 1 are in cell range B19:B27, population 2 are in D19:D23. The formula for calculating the variance of population 1 is in cell C29.
The formula for calculating the variance of population 1 is in cell C30.
The F.TEST function calculates the variances for you, however, I have included those calculations here. The following formula calculates the number of degrees of freedom for the first population:
Degrees of freedom of the second population:
The numbers of degrees of freedoms are also not required in the F.TEST function but these calculations allow me to plot the F distribution, shown in the image above.
The F.TEST function calculates the the two-tailed probability from an F-test. This value shows if the variances from two data sets are not significantly different. In this example, if the variances are significantly different at a 5% significance level.
F test formula in cell D34:
The result is 0.5376 which is significantly greater than 0.05 (5% significance level). This means that there is not enough evidence to reject the null hypothesis of equal variances at the 5% significance level.
5. Example 2

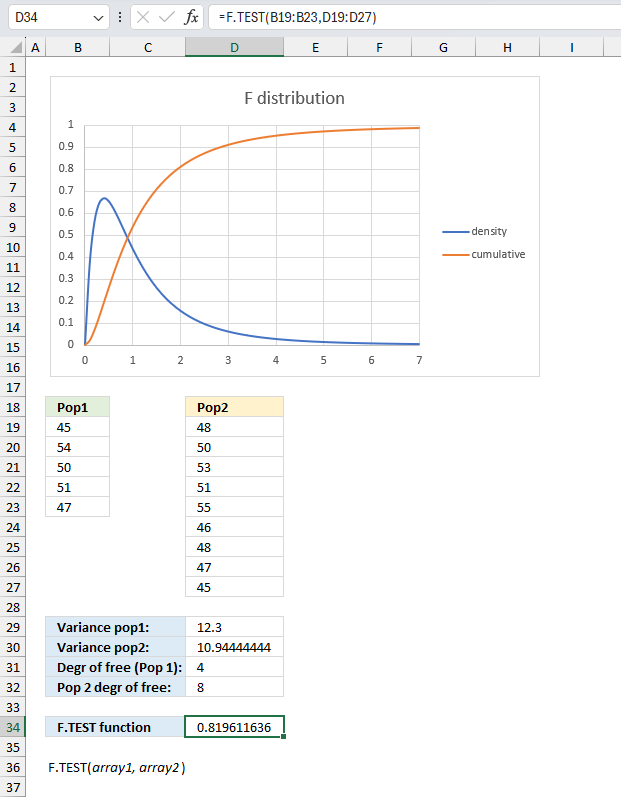
A company manufactures two types of batteries, and you want to compare the variability in their lifetimes. Calculate the F-TEST to check if the variances of the two battery types are equal or not using a 10% level of significance?
The values for population 1 are in cell range B19:B23, population 2 are in D19:D27. The formula for calculating the variance of population 1 is in cell C29.
The formula for calculating the variance of population 1 is in cell C30.
The F.TEST function calculates the variances for you, however, I have included those calculations here. The following formula calculates the number of degrees of freedom for the first population:
Degrees of freedom of the second population:
The numbers of degrees of freedoms are also not required in the F.TEST function but these calculations allow me to plot the F distribution, shown in the image above.
The F.TEST function calculates the the two-tailed probability from an F-test. This value shows if the variances from two data sets are not significantly different. In this example, if the variances are significantly different at a 10% significance level.
F test formula in cell D34:
The result is 0.8196 which is significantly greater than 0.10 (10% significance level). This means that there is not enough evidence to reject the null hypothesis of equal variances at the 10% significance level.
6. Function not working

The F.TEST function returns
- #DIV/0! error value if the number of items in each data set don't match.
- #VALUE! error value if any argument is non-numeric.
The LINEST function calculates the F statistic whereas the F.TEST function calculates the probability.
6.1 Troubleshooting the error value

When you encounter an error value in a cell a warning symbol appears, displayed in the image above. Press with mouse on it to see a pop-up menu that lets you get more information about the error.
- The first line describes the error if you press with left mouse button on it.
- The second line opens a pane that explains the error in greater detail.
- The third line takes you to the "Evaluate Formula" tool, a dialog box appears allowing you to examine the formula in greater detail.
- This line lets you ignore the error value meaning the warning icon disappears, however, the error is still in the cell.
- The fifth line lets you edit the formula in the Formula bar.
- The sixth line opens the Excel settings so you can adjust the Error Checking Options.
Here are a few of the most common Excel errors you may encounter.
#NULL error - This error occurs most often if you by mistake use a space character in a formula where it shouldn't be. Excel interprets a space character as an intersection operator. If the ranges don't intersect an #NULL error is returned. The #NULL! error occurs when a formula attempts to calculate the intersection of two ranges that do not actually intersect. This can happen when the wrong range operator is used in the formula, or when the intersection operator (represented by a space character) is used between two ranges that do not overlap. To fix this error double check that the ranges referenced in the formula that use the intersection operator actually have cells in common.
#SPILL error - The #SPILL! error occurs only in version Excel 365 and is caused by a dynamic array being to large, meaning there are cells below and/or to the right that are not empty. This prevents the dynamic array formula expanding into new empty cells.
#DIV/0 error - This error happens if you try to divide a number by 0 (zero) or a value that equates to zero which is not possible mathematically.
#VALUE error - The #VALUE error occurs when a formula has a value that is of the wrong data type. Such as text where a number is expected or when dates are evaluated as text.
#REF error - The #REF error happens when a cell reference is invalid. This can happen if a cell is deleted that is referenced by a formula.
#NAME error - The #NAME error happens if you misspelled a function or a named range.
#NUM error - The #NUM error shows up when you try to use invalid numeric values in formulas, like square root of a negative number.
#N/A error - The #N/A error happens when a value is not available for a formula or found in a given cell range, for example in the VLOOKUP or MATCH functions.
#GETTING_DATA error - The #GETTING_DATA error shows while external sources are loading, this can indicate a delay in fetching the data or that the external source is unavailable right now.
6.2 The formula returns an unexpected value

To understand why a formula returns an unexpected value we need to examine the calculations steps in detail. Luckily, Excel has a tool that is really handy in these situations. Here is how to troubleshoot a formula:
- Select the cell containing the formula you want to examine in detail.
- Go to tab “Formulas” on the ribbon.
- Press with left mouse button on "Evaluate Formula" button. A dialog box appears.
The formula appears in a white field inside the dialog box. Underlined expressions are calculations being processed in the next step. The italicized expression is the most recent result. The buttons at the bottom of the dialog box allows you to evaluate the formula in smaller calculations which you control. - Press with left mouse button on the "Evaluate" button located at the bottom of the dialog box to process the underlined expression.
- Repeat pressing the "Evaluate" button until you have seen all calculations step by step. This allows you to examine the formula in greater detail and hopefully find the culprit.
- Press "Close" button to dismiss the dialog box.

There is also another way to debug formulas using the function key F9. F9 is especially useful if you have a feeling that a specific part of the formula is the issue, this makes it faster than the "Evaluate Formula" tool since you don't need to go through all calculations to find the issue..
- Enter Edit mode: Double-press with left mouse button on the cell or press F2 to enter Edit mode for the formula.
- Select part of the formula: Highlight the specific part of the formula you want to evaluate. You can select and evaluate any part of the formula that could work as a standalone formula.
- Press F9: This will calculate and display the result of just that selected portion.
- Evaluate step-by-step: You can select and evaluate different parts of the formula to see intermediate results.
- Check for errors: This allows you to pinpoint which part of a complex formula may be causing an error.
The image above shows cell reference B19 converted to hard-coded value using the F9 key. The F.TEST function requires at least two data points in each argument which is not the case in this example. We have found what is wrong with the formula.
Tips!
- View actual values: Selecting a cell reference and pressing F9 will show the actual values in those cells.
- Exit safely: Press Esc to exit Edit mode without changing the formula. Don't press Enter, as that would replace the formula part with the calculated value.
- Full recalculation: Pressing F9 outside of Edit mode will recalculate all formulas in the workbook.
Remember to be careful not to accidentally overwrite parts of your formula when using F9. Always exit with Esc rather than Enter to preserve the original formula. However, if you make a mistake overwriting the formula it is not the end of the world. You can “undo” the action by pressing keyboard shortcut keys CTRL + z or pressing the “Undo” button
6.3 Other errors
Floating-point arithmetic may give inaccurate results in Excel - Article
Floating-point errors are usually very small, often beyond the 15th decimal place, and in most cases don't affect calculations significantly.
Functions in 'Statistical' category
The F.TEST function function is one of 73 functions in the 'Statistical' category.

How to comment
How to add a formula to your comment
<code>Insert your formula here.</code>
Convert less than and larger than signs
Use html character entities instead of less than and larger than signs.
< becomes < and > becomes >
How to add VBA code to your comment
[vb 1="vbnet" language=","]
Put your VBA code here.
[/vb]
How to add a picture to your comment:
Upload picture to postimage.org or imgur
Paste image link to your comment.
Contact Oscar
You can contact me through this contact form